Sampling IATI data round 1: Lessons learned
Data collection continues for the 2014 Aid Transparency Index (ATI). And for the first time, we are sampling documents and data on the results, conditions and sub-national location published to the IATI Registry in XML format.
Sampling essentially means manually checking that the information provided is specific to that activity, has been appropriately tagged using IATI codes, and that it adheres to the ATI indicator guidelines.
The prospect of sampling documents and data for 16 ATI indicators, covering 25+ IATI standard elements, across 27 IATI publishers, was a daunting one. But we knew we had to plough our way through to ensure the information published about aid is relevant and of good enough quality to be used.
Yet this task turned out to be much more fun – and much less arduous – than we feared.
The good examples we found highlighted the potential of IATI data. There were plenty of things to get excited about. We’re happy to note in this first round of sampling that 82% of the 27 IATI publishers sampled passed the sampling checks for the indicators they publish.
The Good
As we clicked through the documents and IATI excerpts randomly selected for us by our sampling tool, there were many examples of good practice:
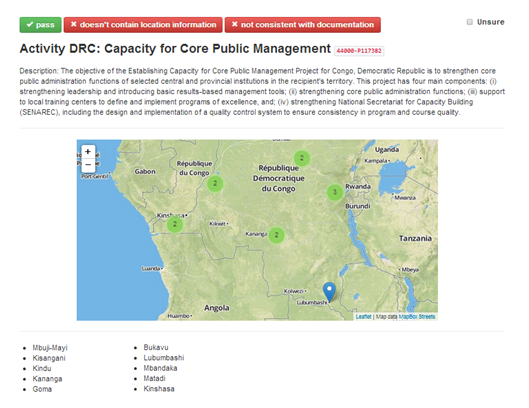
- Subnational geo-coding: The European Commission’s Foreign Policy Instrument Services, the Netherlands, African Development Bank (AfDB) and the World Bank are all publishing excellent geo-coded data, enabling us to see the coverage of project activities clearly within each country.

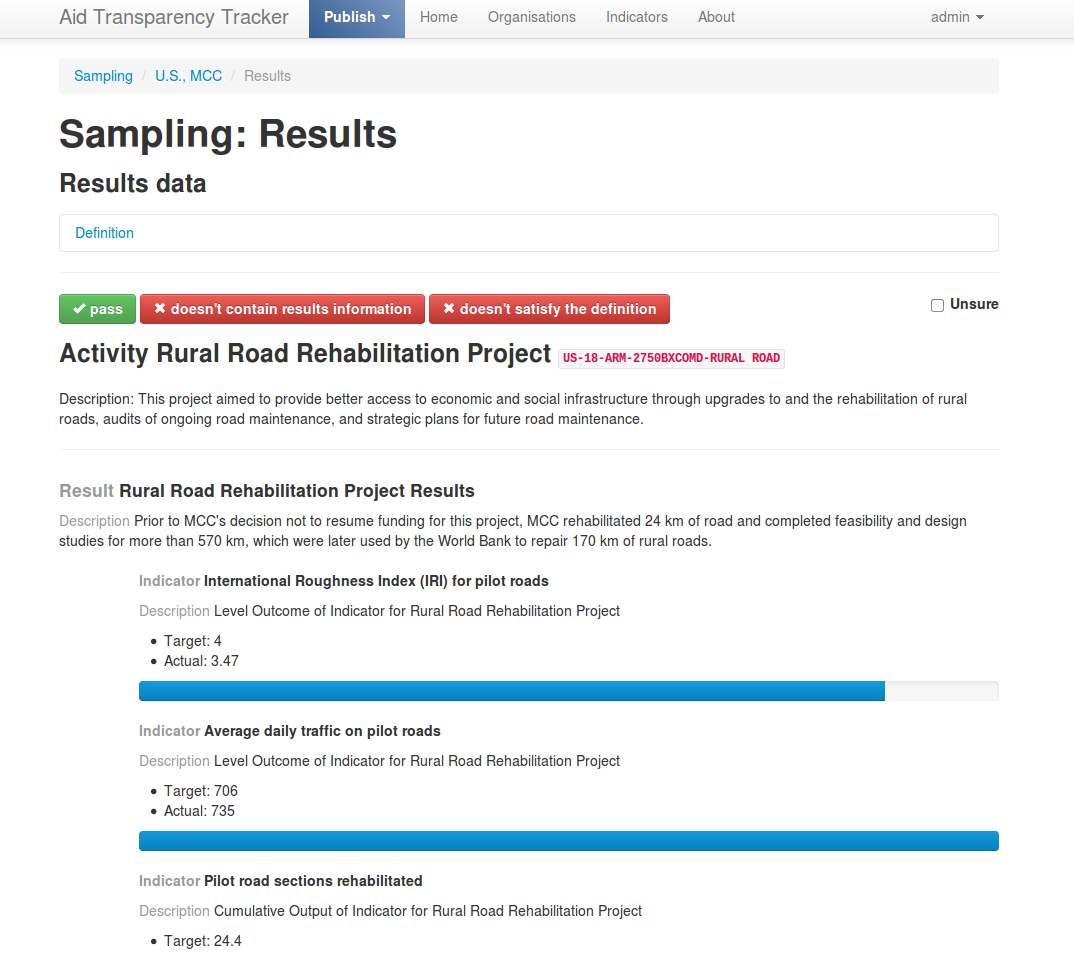
- Results documents and data: Some results information clearly shows whether activities have achieved their intended outputs against stated goals. GAVI, Asian Development Bank (AsDB), Inter-American Development Bank (IADB), World Bank, and DFID have some great results documents, and Global Fund, Sweden and Canada have some good examples of structured data.

- Appropriate language use: Several organisations (IADB, AfDB, UNDP) are publishing documents and IATI data fields using the language of the recipient country, making it more accessible for in-country users.
The Bad
Some less than helpful trends emerged too…
- Over tagging: Some organisations are linking many documents to a single IATI category code, even when the code isn’t relevant to that document. This effectively renders the use of codes meaningless, making it very difficult to find the information you seek.
- Inaccessible data: On a few occasions we were unable to access documents because of broken links. The use of scanned PDFs also makes the data difficult to parse and scrape. Document links led to generic web pages, with no clues on how to find documents for specific activities. Some samples were difficult to understand due to the acronyms and shorthand used to describe information.
- Incoherence within data: Occasionally the codes used in the IATI data didn’t match the documents tagged. For example, country strategies tagged as organization strategies. There are several cases where the data specifies that no conditions are attached but conditions documents, with clear conditions outlined, are tagged!
The Ugly
Finally, a tiny percentage the IATI data we sampled was incomprehensible. Activities had no titles or descriptions, and were just lists of unlabelled transactions. This makes the information fairly useless to pretty much everyone. Queue many unrepeatable mutterings, long sighs and exasperated researchers.
The reality hit that it’s not possible to truly celebrate IATI publication until it is done well. Done badly, it serves very little use at all.
In summary…
Sampling has showed us the potential of using XML for publishing aid data for a wide variety of organisations. The elements of the IATI code had been used in many different ways, depending on what fits best with organisation’s particular structure and activities. When accurate and well-coded, it became clear that IATI data makes it easy to compare aid spending across time, space and many organisation types.
But it has also shown that unless the IATI standard is adhered to, the information published runs the risk of being difficult to understand, difficult to access, and difficult to reuse. Although it’s our impression that the majority of the errors we found were unintentional, it’s important that they are fixed to deliver on the full potential of IATI – of comprehensive, comparable aid data.
Now with data collection complete for 2014, we’re busy finalising and analysing the dataset so we can see this year’s results. Watch this space!

Guest post by Ruth Salmon, Research Assistant. She is the lead on data collection for the 2014 Aid Transparency Index.

